Six years of Improvements in Campbell County
I only have a few weeks left in Campbell County, and I wanted to reflect on it. I want to write about the improvements that we have made since I’ve been here. In district supervisor positions, you’re always on a continuum of change and improvement. The truth is the job is never finished.
The other truth is that you never do this job alone. I have been part of one of the strongest teams I can even imagine. So please don’t read this blog that these are my accomplishments. I’ve only been fortunate to have been part of them.
It is a team effort that is led by the Director of Schools. If you don’t have a strong Director, then it is tough to get anything accomplished. In this situation, I had a very strong Director in Ms. Fields who pushed all of us to balance improvement while considering the already strenuous workload on teachers, principals, and students. Ms. Fields also reminded us regularly not to forget what it’s like to be in a classroom and to lead a school. She encouraged us to be empathetic to our people but to have high standards for our outcomes. This balance is what has allowed all of us to be successful.
In no order of importance, I thought I would reflect on some of the accomplishments that come to mind.
Collaborative Conferencing
Being involved in PECCA was a great experience. It really put me in touch with the past, present, and future of Campbell County. When I initially came on the Administration Team, there were a lot of employee organization leaders who had been involved in Collective Bargaining prior to 2011. I remember these folks and their work, and I noticed the MOU felt more like the Collective Bargaining Agreement than an MOU.
Something else that became obvious to me is that most teachers had no idea that they had an MOU and that they had all of these people working on it. It is hours of work after hours for which no one is getting paid anything extra. It is truly a labor of love, and for employee organizations, it is the most direct form of advocacy that they have.
While I agreed with most of what was there, there were some glaring loopholes that needed to be closed. For example, the MOU originally read that a teacher could take up to 20 consecutive days of unpaid leave before they were put on unpaid leave by the Director of Schools. This meant that a teacher could take 19.5 days off, come back for half a day, and then take 19.5 days off again. This means a teacher could keep their position while only showing up for 8 days a school year. It wasn’t until this was being discussed that I saw an employee test these waters, but we finally changed it.
The section on unpaid leave is now more in line with policy and procedures. It states, “To prevent being placed on automatic leave, in cases where the teacher cannot apply for leave under the Family Medical Leave Act, the teacher must provide documentation to the Director of Schools to justify their unpaid leave. “This was a lot of work and discussion by the PECCA Members from both the Admin Team and the Teacher Team. I consider it a huge accomplishment that we got this done, and even added a definition of sick leave which was completely missing.
Let me be even more emphatic about it: there was no sick leave policy for certified employees at all. This is why it was being abused and people had an entitled attitude about “their days.” These days technically belong to the state which is why you get to transfer them from system to system, and the state is very clear about how they are to be used. Scanning other systems’ policies for sick leave showed just how restrictive they were elsewhere, and I felt like I was spinning my wheels trying to solve Chronic Student Absenteeism when I couldn’t solve Chronic Teacher Absenteeism.
It is very satisfying to look back on that work to see that everyone in the group saw that this wasn’t a tenable situation for a school system that wanted to be whole and healthy. At our best, we had everyone working together. There were some long evenings and not everyone saw eye-to-eye, but in the end, we got things done, and I will always be proud of that.
Test Scores
To be clear, the test scores always belong to the students. After all, they’re the ones who take the tests. Even though this is true, test scores are the backbone of school accountability, and even though that changed dramatically with the school letter grades, we’ve been getting school report cards for a long time.
For those who aren’t in education, there are two ways to look at your progress in test scores. One way is called “Achievement” and the other way is called “Growth.” Achievement is the percentage of students who score “proficient” on the TCAP or EOC. Growth is a complex measure that predicts what a student’s test score should be, and then whether it is above that or below it, it is considered positive or negative growth. When put all of that together, you get a teacher’s growth, a school’s growth, and so on.
In Campbell County, our Achievement has improved every single year. As you can see from this School Board Data Presentation, it has improved every year.
District Achievement Overview
The provided charts illustrate the trends in district achievement over time, specifically focusing on the growth in English Language Arts (ELA) and Math across different grade levels: elementary (grades 3-5), middle (grades 6-8), and high school (grades 9-12).

District Achievement Over Time
-
Grades 3-5: Achievement increased from 23 in 2020-2021 to 34 in 2022-2023, indicating an 11-point growth.
-
Grades 6-8: Achievement rose from 17.5 in 2020-2021 to 25 in 2022-2023, marking a 7.5-point growth.
-
Grades 9-12: Achievement saw a significant rise from 14.4 in 2020-2021 to 26.8 in 2022-2023, showing a 12.4-point growth.
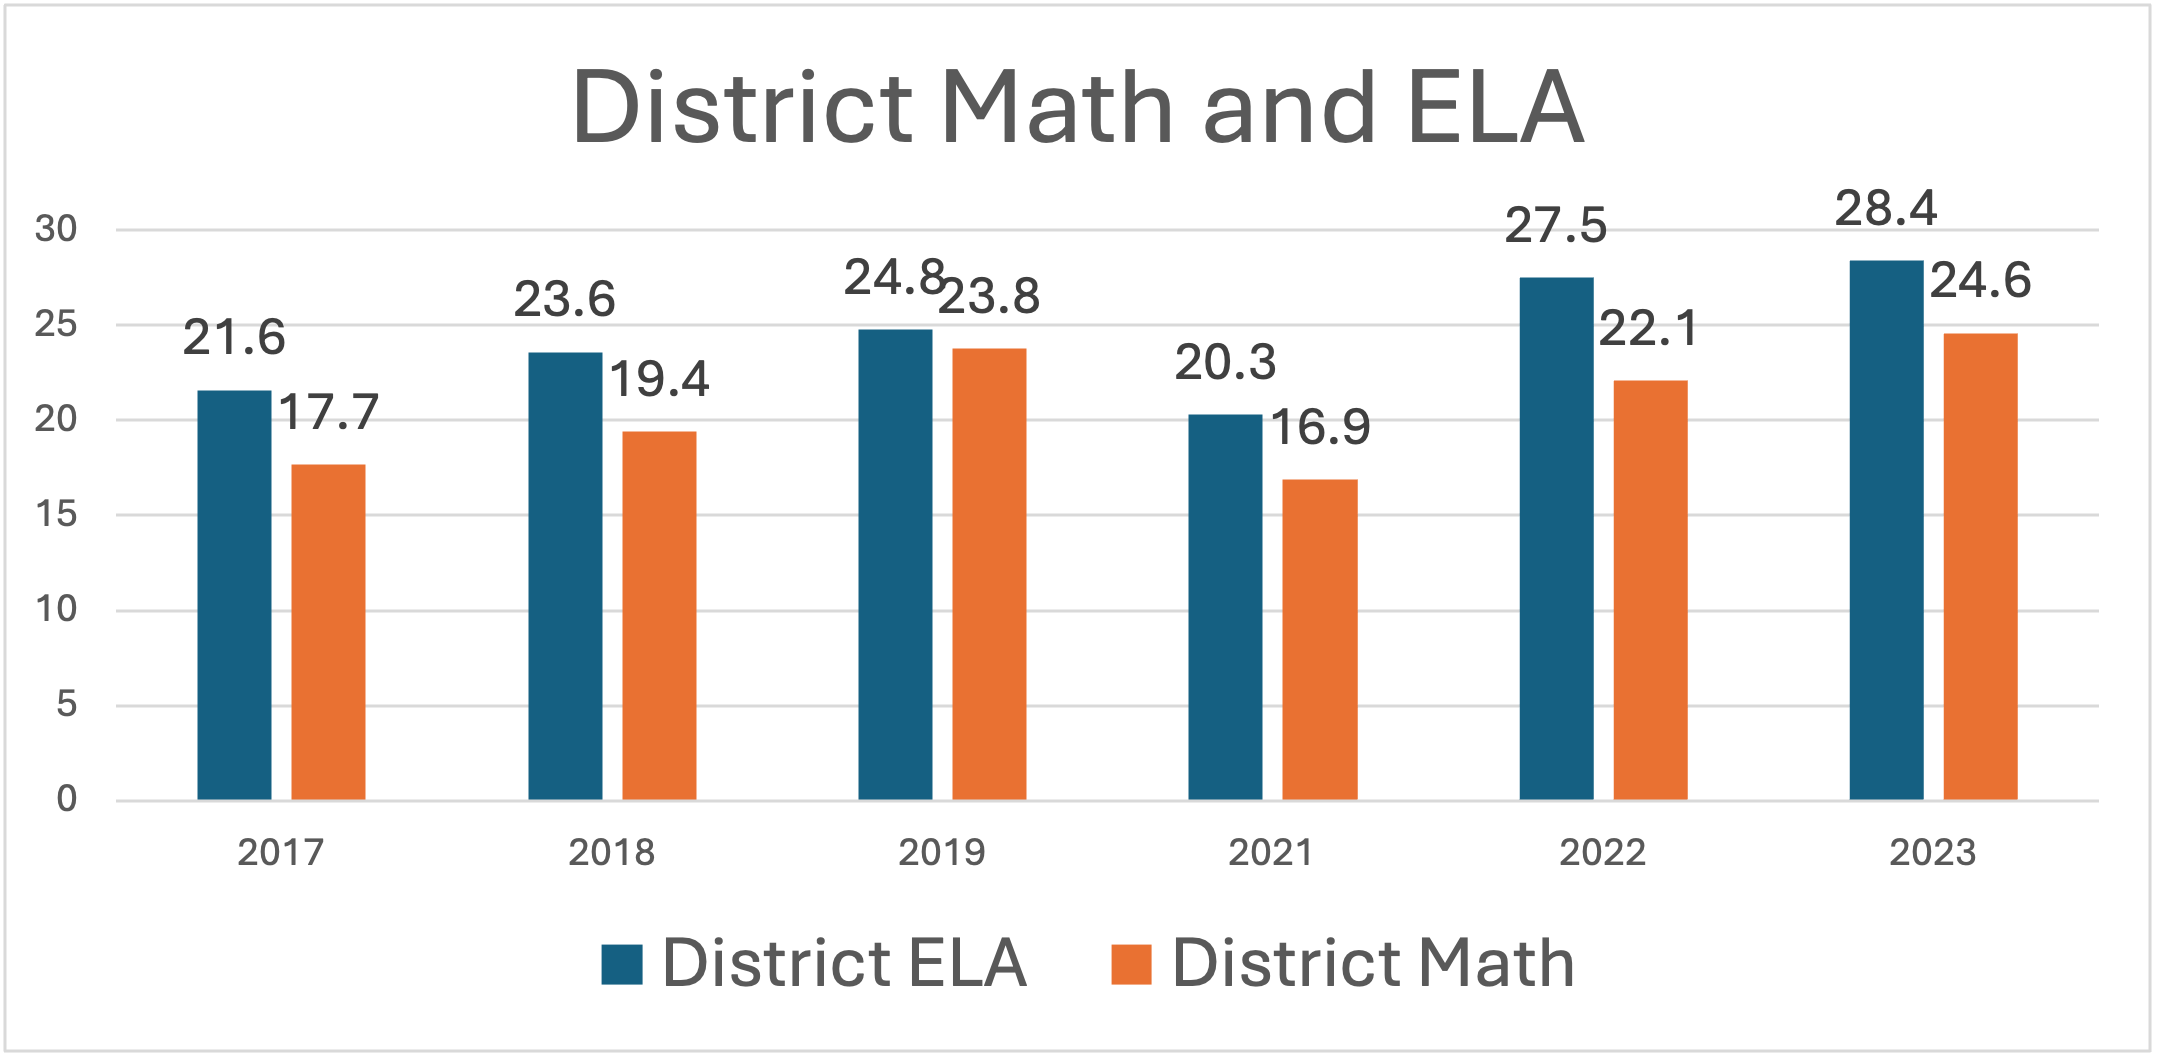
District-wide Performance in ELA and Math
-
Overall Trends: Both ELA and Math have shown considerable growth over the years, with notable increases from 2021 to 2023.
-
ELA: Increased from 21.6 in 2017 to 28.4 in 2023.
-
Math: Grew from 17.7 in 2017 to 24.6 in 2023.
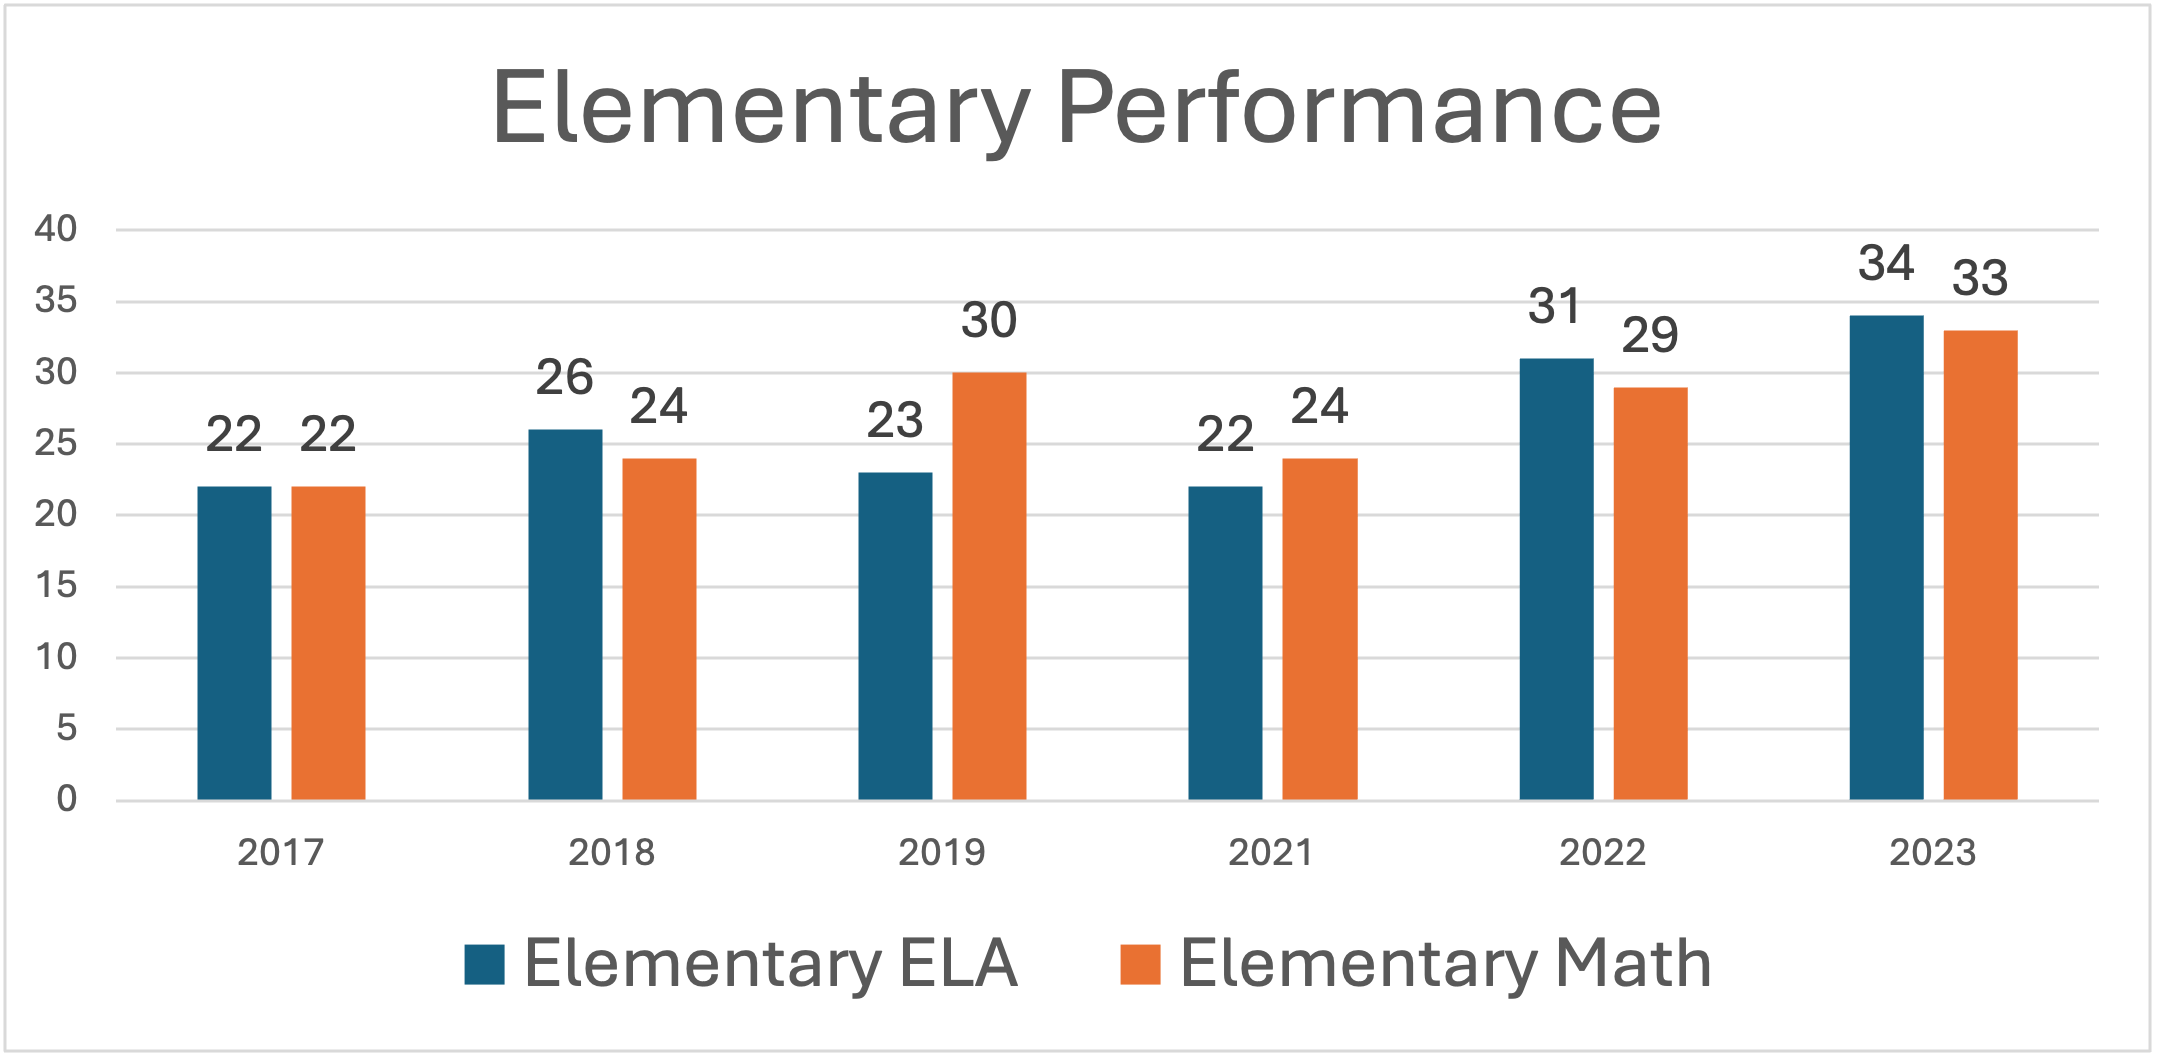
Elementary School Performance
-
ELA: The performance has steadily increased, reaching 34 in 2023 from 22 in 2017.
-
Math: Similarly, Math performance rose to 33 in 2023 from 22 in 2017.
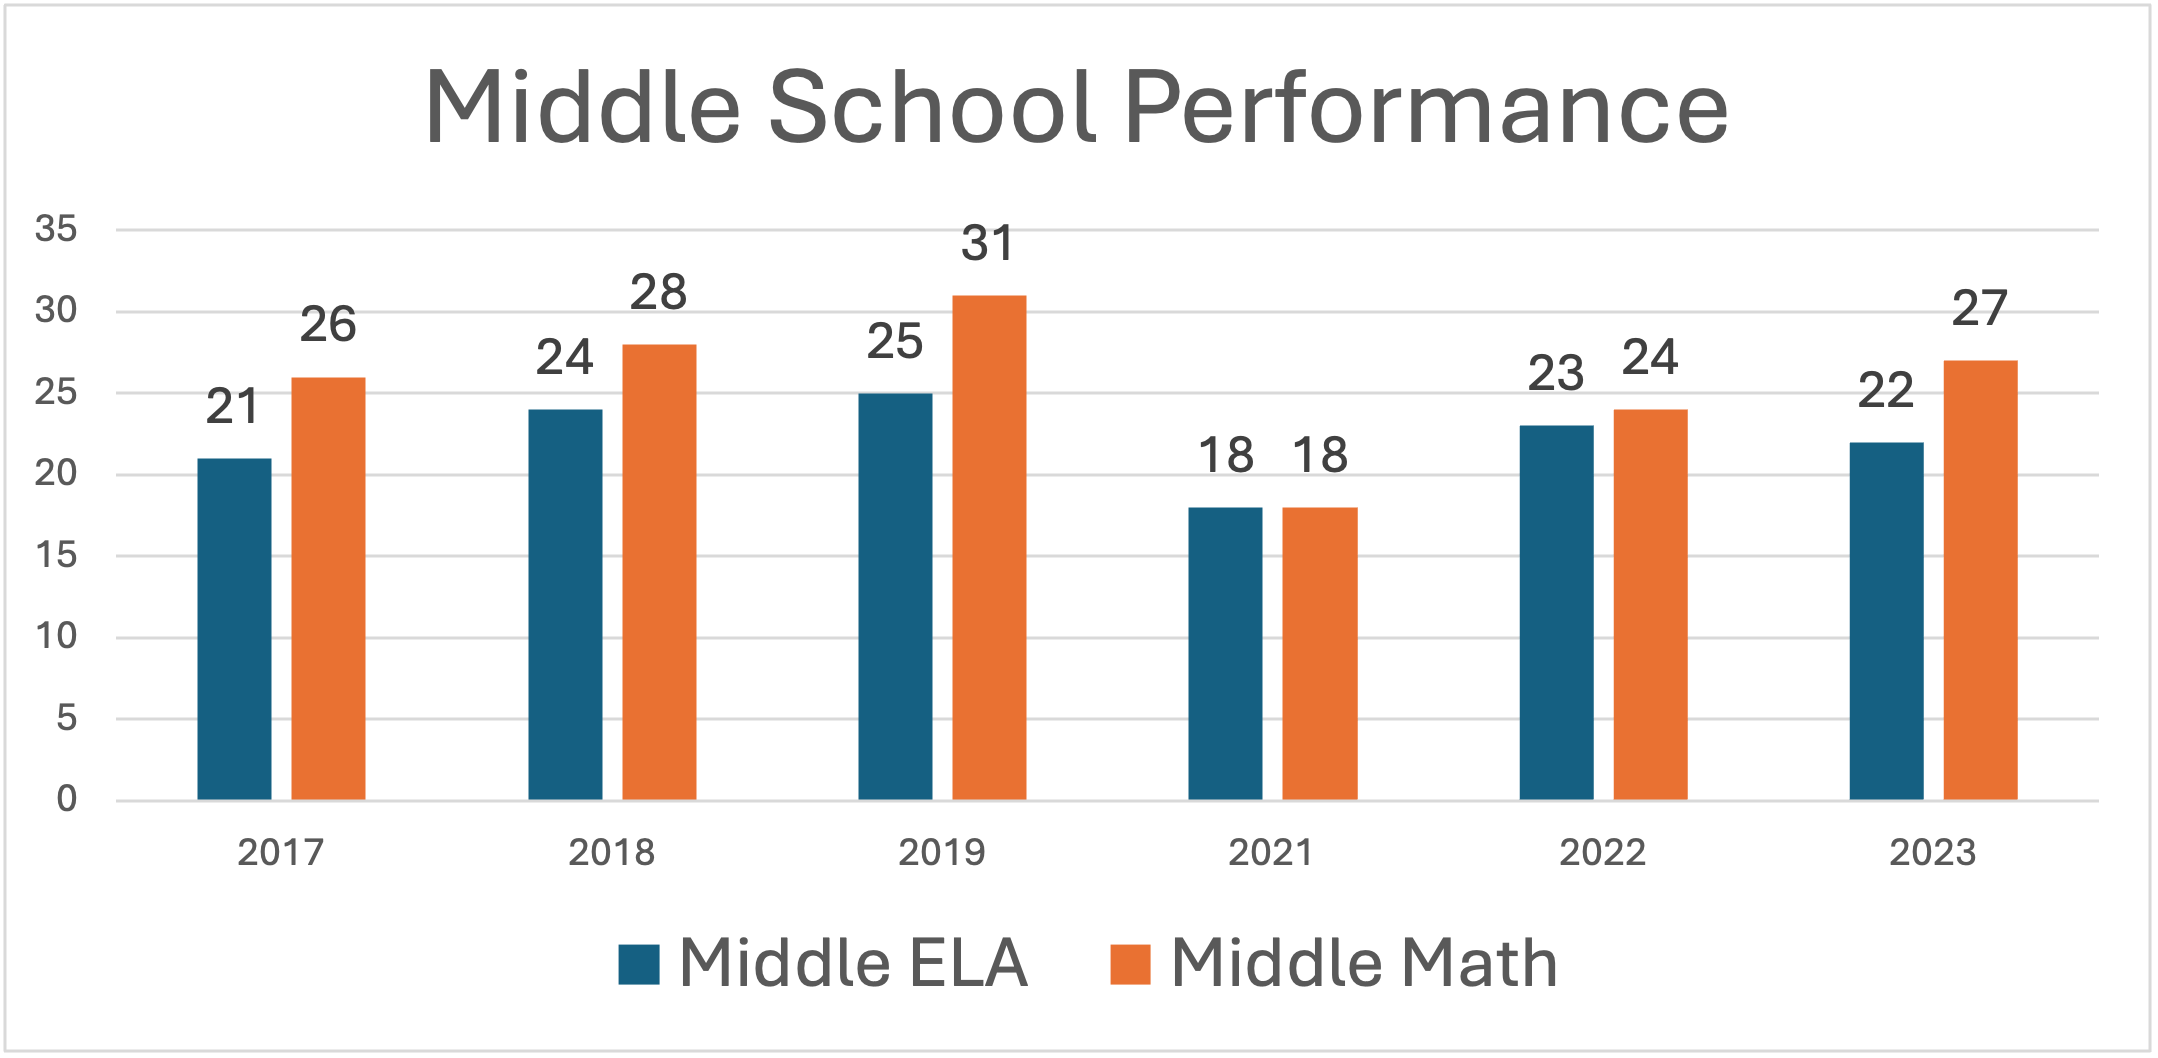
Middle School Performance
-
ELA: After a drop in 2021, ELA performance rebounded to 22 in 2023, slightly below the 2019 peak of 25.
-
Math: Following a dip in 2021, Math performance recovered, reaching 27 in 2023, just shy of the 2019 peak of 31.
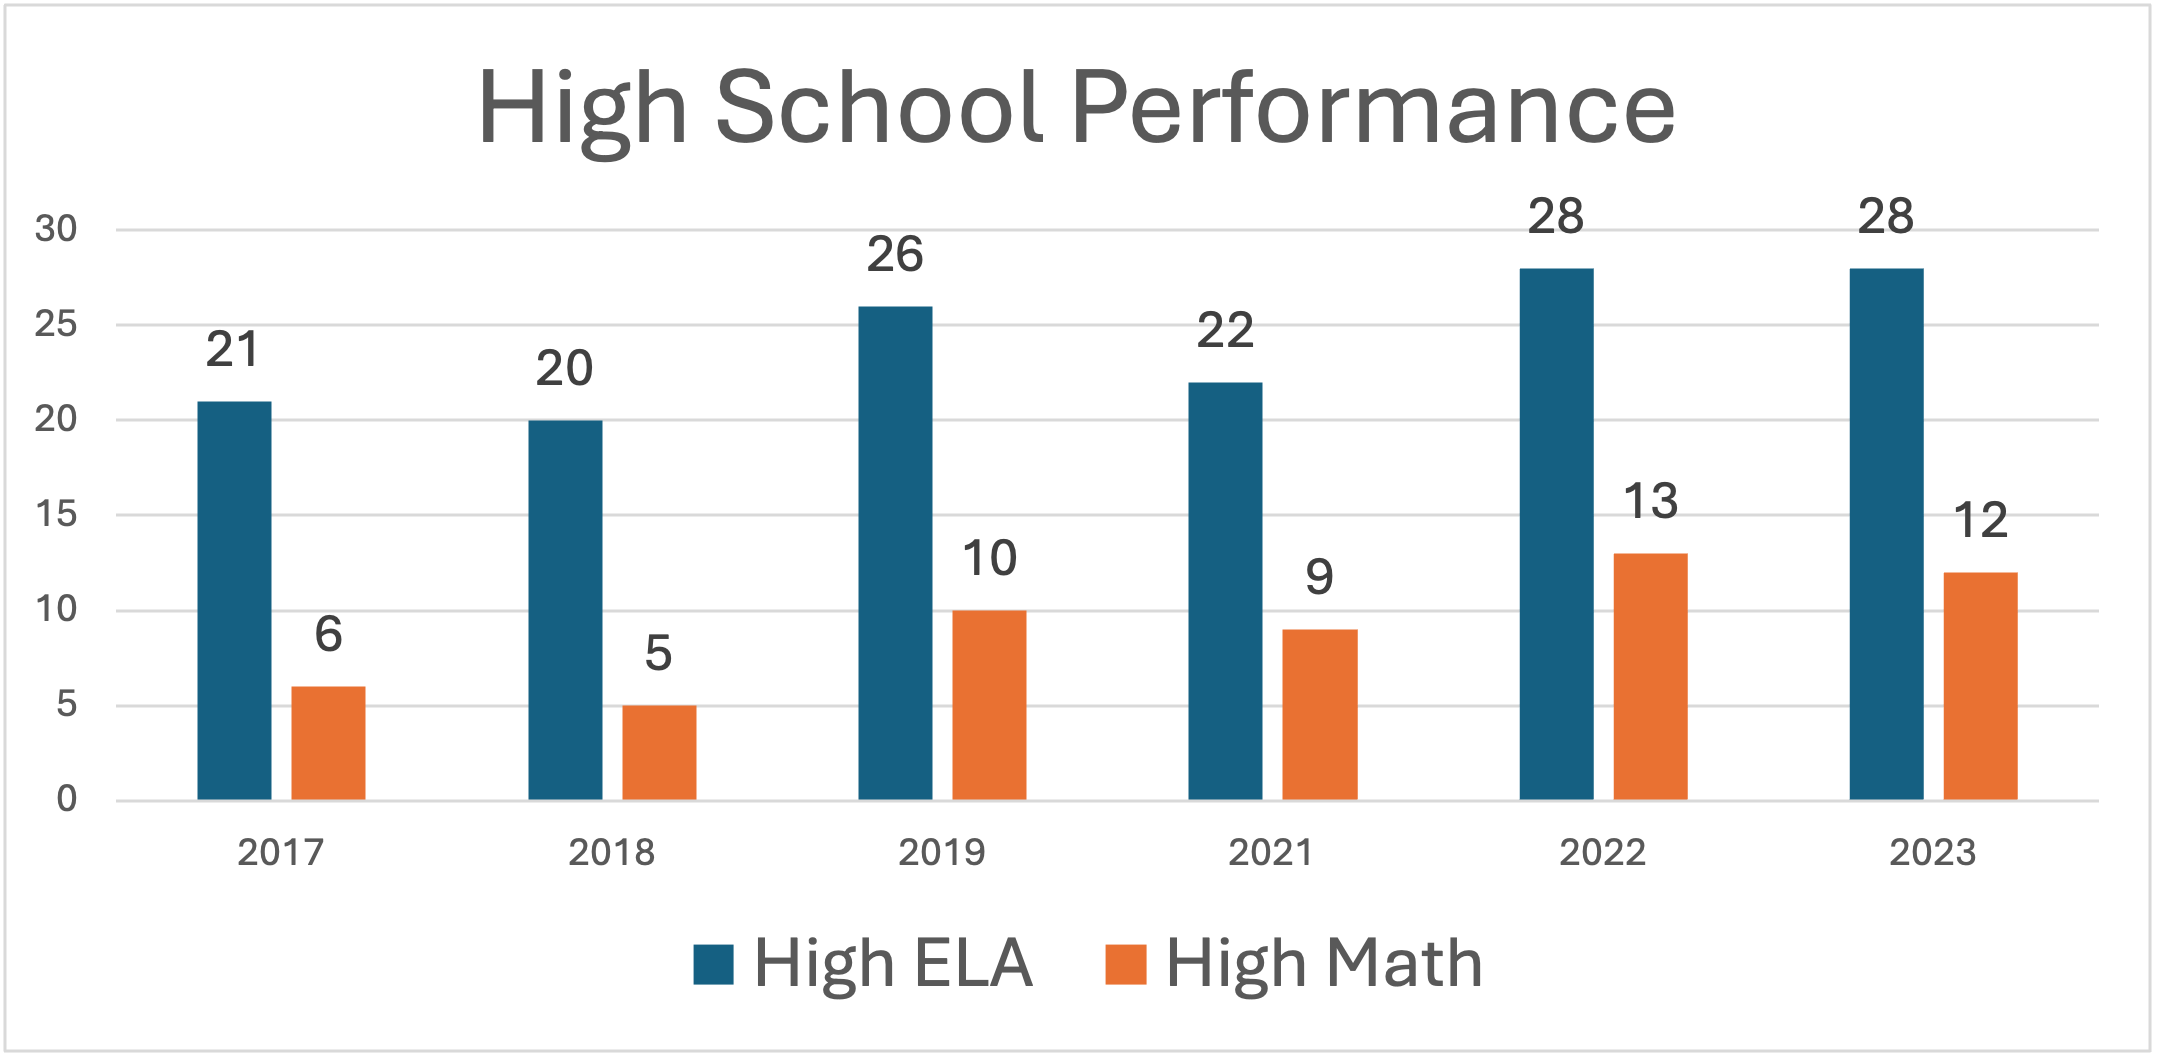
High School Performance
-
ELA: High school ELA performance has shown significant improvement, reaching 28 in 2023, up from 21 in 2017.
-
Math: Despite some fluctuations, Math performance improved to 12 in 2023 from a low of 5 in 2018.
Comparative Insights
- Elementary School Improvement:
- Both ELA and Math have shown consistent improvement, suggesting effective early education strategies. The continuous rise in performance indicates a solid foundation being built at this level.
- Middle School Improvement:
- ELA and Math faced a dip in 2021, likely due to disruptions caused by external factors (e.g., the pandemic). However, the rebound in 2022 and 2023 suggests recovery efforts are taking effect, though there’s room for improvement to reach or exceed past peaks.
- High School Improvement:
- ELA shows a marked improvement, indicating effective teaching strategies and student engagement at the high school level. Math, while improving, shows more variability, highlighting the need for targeted interventions to sustain and further this growth
Growth
Growth tells a different story than achievement. While many of our students are performing better than they were in 2017, the overall district growth decreased from a level 3 to a level 1 in 2023. The reason for this is because of so many large negative growth scores. This suggests that students are not performing their best on the test. Given their benchmarking scores suggest they are capable of performing better than they did, it suggests that students are just not trying on the TCAP and EOC tests. We are putting in a lot of programs to make that happen.
Here are high school growth levels over the past three years:
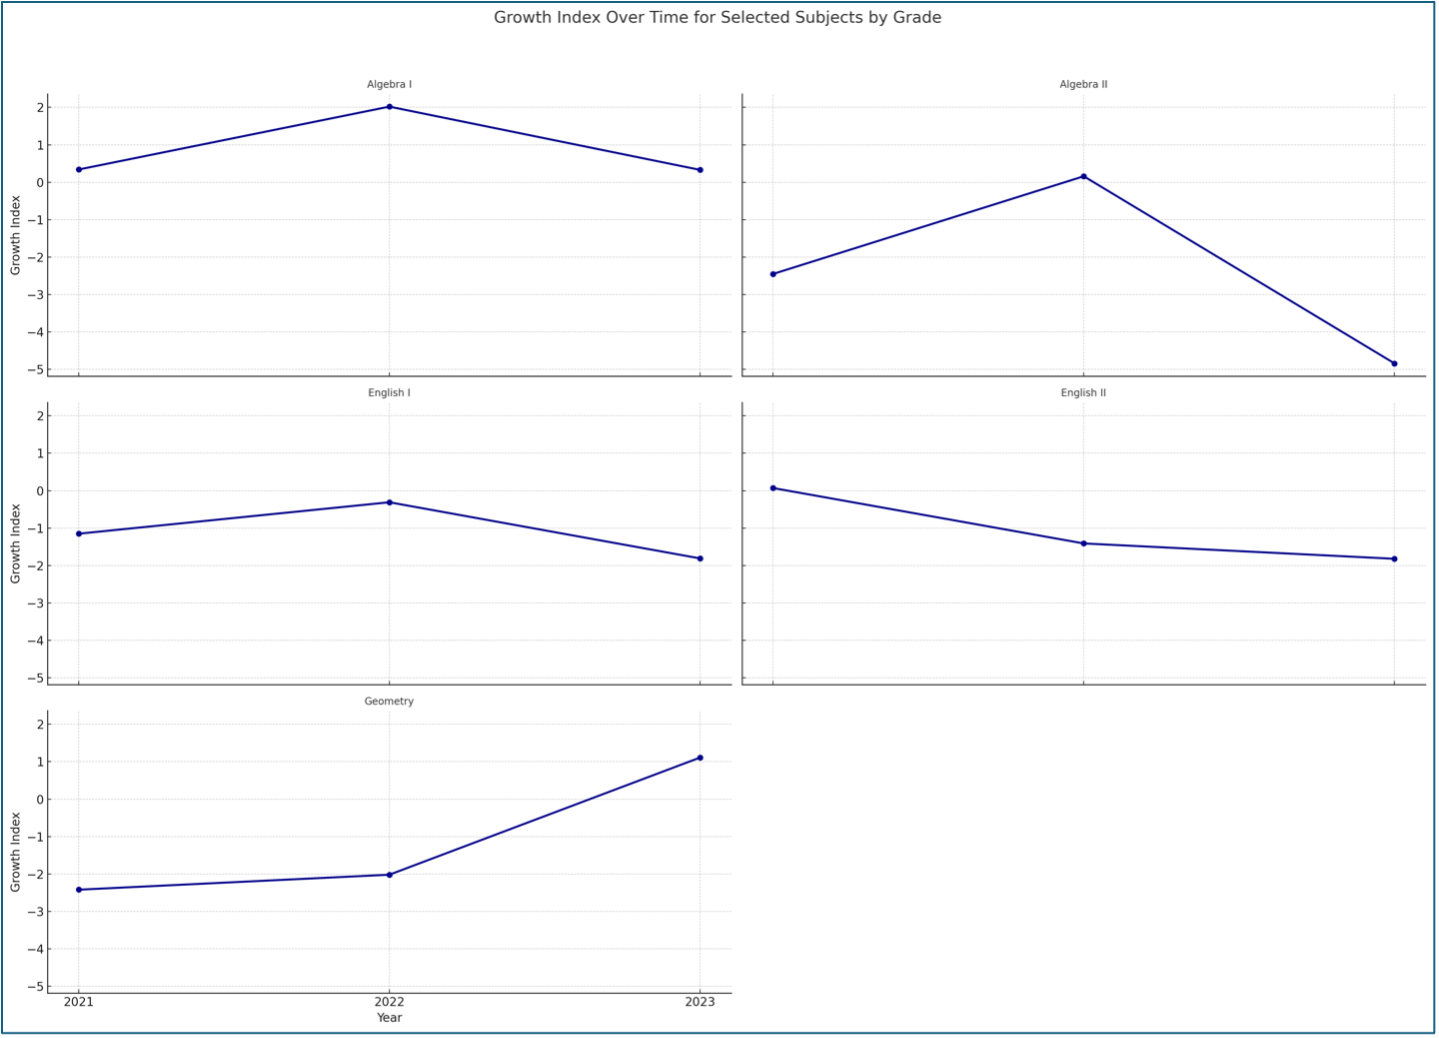
The analysis of high school growth indices for the subjects Algebra I, Algebra II, English I, English II, and Geometry over the years 2021 to 2023 reveals several trends and insights.
- Algebra I:
- The Growth Index shows a positive trend initially, peaking in 2022. However, there is a noticeable decline in 2023, bringing the index closer to its 2021 level. This suggests that while there was initial improvement, the gains were not sustained.
- Algebra II:
- Similar to Algebra I, Algebra II also experienced an upward trend, peaking in 2022 before a significant decline in 2023. This indicates a potential issue in maintaining growth in Algebra II over the long term.
- English I:
- The Growth Index for English I shows an initial increase, peaking in 2022, followed by a decline in 2023. Despite the fluctuation, the overall trend suggests a need for focused strategies to sustain and improve growth.
- English II:
- English II demonstrates a consistent decline in the Growth Index from 2021 to 2023. This steady decrease highlights the need for interventions and targeted support to reverse the downward trend.
- Geometry:
- Geometry shows a positive and continuous increase in the Growth Index from 2021 to 2023, indicating successful strategies and improvements in teaching and learning practices in this subject.
Overall, the high school data reflects a mixed performance with notable areas for improvement, especially in maintaining growth in Algebra I, Algebra II, and English I, and reversing the decline in English II. The positive trend in Geometry is encouraging and may serve as a model for other subjects.
Here are growth rates for Math and ELA in Grades 3-8:
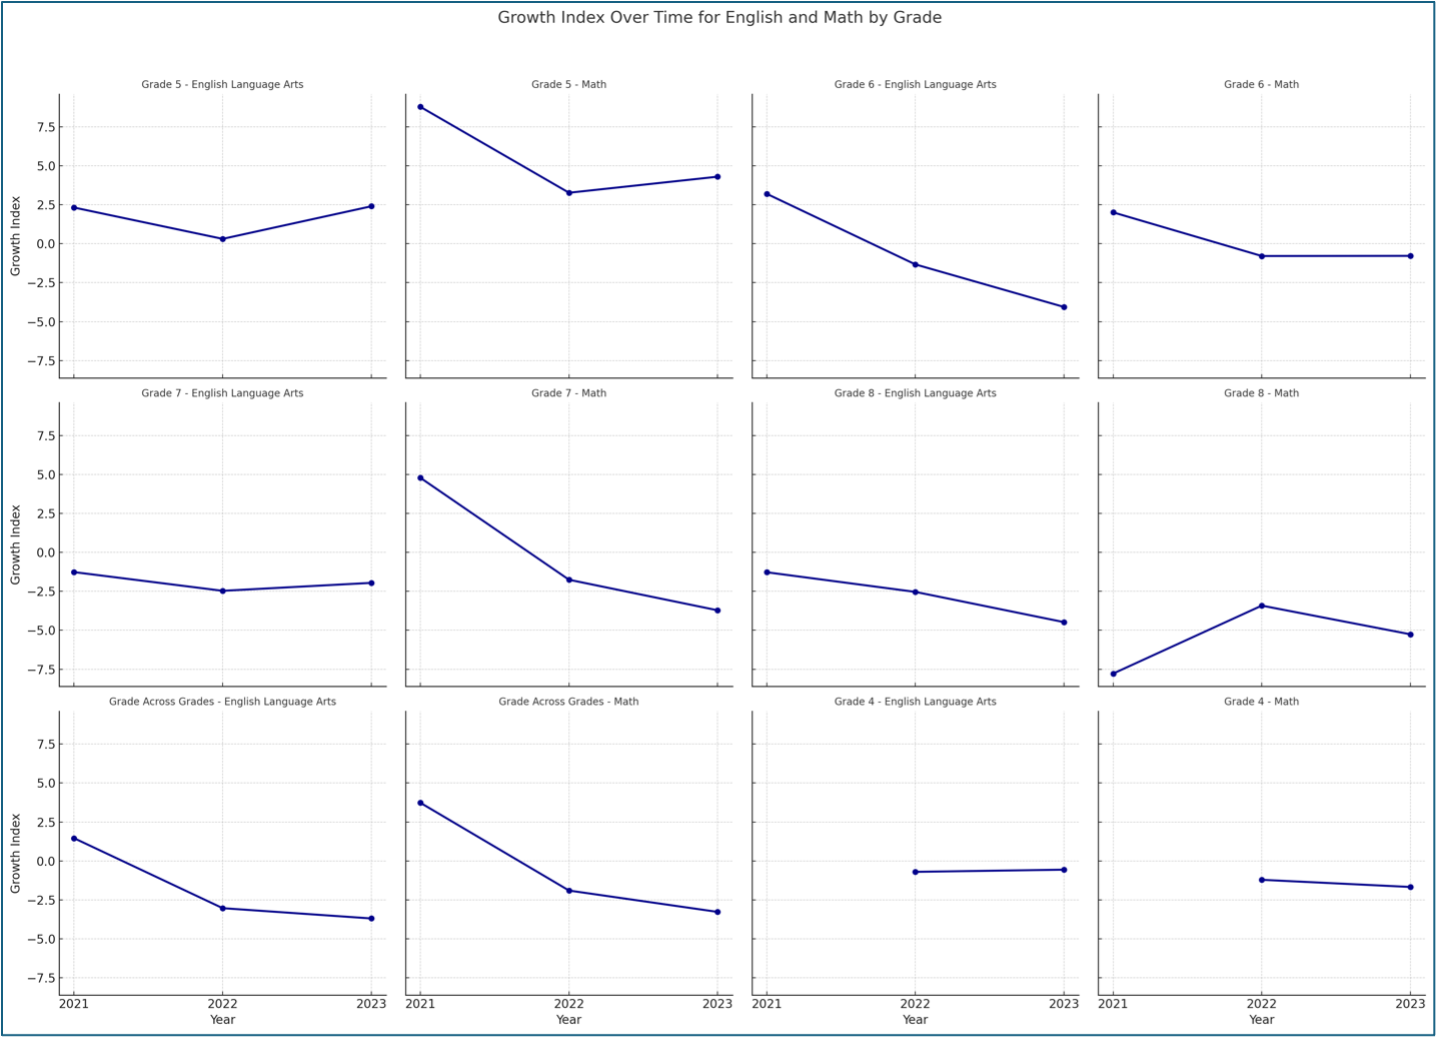
Subjects: English Language Arts (ELA) and Math
The analysis of growth indices for English Language Arts (ELA) and Math for grades 4-8 over the years 2021 to 2023 provides insights into student performance and areas needing attention.
- English Language Arts (ELA):
-
Grade 4: The Growth Index for ELA in Grade 4 remained relatively stable, indicating consistent performance without significant fluctuations.
-
Grade 5: The Growth Index shows minor fluctuations but remains generally stable, suggesting a need for sustained support to drive further improvement.
-
Grade 6: There is a steady decline in the Growth Index from 2021 to 2023, indicating challenges in maintaining growth and highlighting the need for targeted interventions.
-
Grade 7: The trend shows a slight decline, calling for strategies to enhance growth and support students in this grade.
-
Grade 8: The Growth Index shows a consistent decline, indicating significant challenges and a need for robust interventions to reverse the trend.
- Math:
-
Grade 4: Math shows a stable but slightly declining trend, emphasizing the need for continuous support.
-
Grade 5: The Growth Index for Math displays a declining trend, suggesting areas needing improvement.
-
Grade 6: Similar to ELA, the Math Growth Index shows a decline, pointing to a need for targeted efforts to boost performance.
-
Grade 7: The trend shows a decrease, indicating challenges in maintaining growth.
-
Grade 8: The Growth Index shows fluctuations, with a decline from 2022 to 2023, indicating areas needing attention and support.
Overall, the data for grades 4-8 highlights the need for sustained efforts to improve and maintain growth in both ELA and Math. While some grades show stability, others indicate significant areas for improvement, particularly in grades 6-8. Focused interventions and continuous support are essential to reverse declining trends and enhance overall student performance in these critical subjects.
One of the biggest changes we’ve made is the transparency with data. When I came on board, I was told that AMOs (Annual Measurable Objectives) were handed out on a sticky note. I was also told that they would present whatever they wanted about data before the board. While testing accountability wasn’t as hot and heavy as it now, they still had the same numbers to give the board.
Ultimately, more students are performing better on their state tests, and that is good news for the students in Campbell County. This is a group effort from students, teachers, principals, and central office administrators.
ACT
Campbell County improved its ACT average from 16.6 in 2020-2021 to 17.3 in 2022-2023. Also, the county the most students with an ACT over 21 in its history in 2022-2023. Also the participation rate for ACT is 99%. It had fallen below 95% in 2017-2018.
Ready Graduate
The percentage of Ready Graduates has increased from 26.5% in 2017-2018 to 40.1% in 2023-2024.
CTE Concentrators
The percentage of CTE Concentrators improved from 36.5 in 2017-2018 to 54.3% in 2022-2023.
PostSecondary Going Rates
- Pre-Pandemic Growth:
- The district saw a steady increase in postsecondary enrollment rates from 2016-2017 to 2018-2019, peaking at 57.3%. This suggests effective strategies and strong support systems were in place to encourage students to pursue higher education.
- Impact of COVID-19:
- The 2019-2020 and 2020-2021 academic years saw a decline in enrollment rates, dropping to 47.3% and 46.9%, respectively. The disruptions caused by the pandemic likely played a significant role in this decline. These years highlight the challenges faced by students and the need for adaptive strategies during crises.
- Post-Pandemic Recovery:
- The increase to 51.8% in 2021-2022 indicates a positive recovery trend. This suggests that the district’s efforts to support students in the aftermath of the pandemic are beginning to take effect.
Processes
There have been so many processes that have improved since 2018. It is impossible to list them all, but here are the ones that come to mind. Again, these are all group efforts.
· A comprehensive VOIP telephone system for the entire county.
· A modern website with an app.
· A robocall system for absences and emergencies.
· Upgraded technology for every school.
· A Facebook page for the district and every school.
· Teacher of the Year recognition
· An online application and HR system
· Compliance with the new counselor standards
· Updated 504 procedures
· Enrollment Dashboarding
· Conduct Data Collection
· A Tiered System for Truancy
· Data and Accountability updates for principals
· Weekly TEAM reports
· Ayers training for Academic Coaches
· Regular meetings for Academic Coaches
· A leadership academy for teachers.
· A process for awarding and tracking tenure.
· A solid chain of command structure.
· McREL Training
· SREB Training
· Interventionist Positions
· Increased AP and Dual Enrollment participation
· Vans for CTE and for Homeless student transportation
· Ayers Scholars Program
· FAFSA Frenzy
· Turf fields at both high schools (JHS is currently being planned.).
· We trained over 250 substitute teachers while I was there.
· We built an online platform during COVID.
· We had some of the fewest COVID closures in the state.