The ABS Tracker at the All-Star Break
The All-Star Game is Tuesday in Philadelphia, which means every baseball writer in America is contractually obligated to file a midseason check-in.
Back in June I wrote about the ABS Challenge Tracker I built to follow MLB’s automated ball-strike challenge system: who wins challenges, which umpires get overturned, and whether any of it matters in the standings. Since then the tracker has run itself, a weekly job on my Mac and a daily GitHub Action feeding the live dashboard. The sample has grown from about 3,900 challenges to 6,040 across roughly 1,370 games, through Sunday’s first-half finale. Here is what the bigger pile of data says.
The number that refuses to move
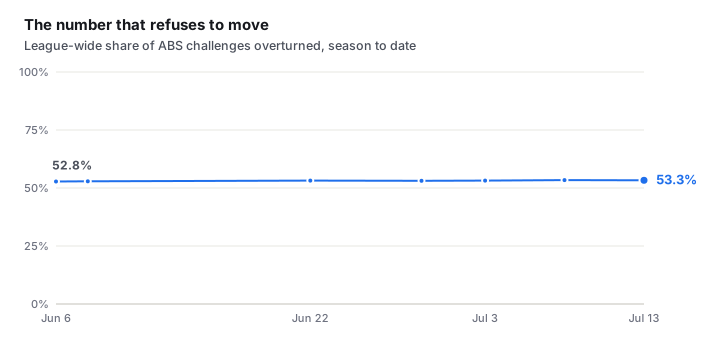
League-wide, 53.3% of challenges get overturned. When I first pulled the data on June 6 it was 52.8%. More than 2,100 challenges later, it has moved about half a point.
That flatness is the most interesting finding so far. If teams were learning when to challenge, you would expect the success rate to creep up as the season goes on. It is not creeping. Players challenge, and the call flips just a little more than half the time, week after week, like the sport has found its natural equilibrium of arguing.
The one reliable split: challenges from the defensive side succeed 58.0% of the time, while hitters win only 47.9% of theirs. Catchers remain the best judges of the strike zone in the building, including the guy standing behind them.
New team on top
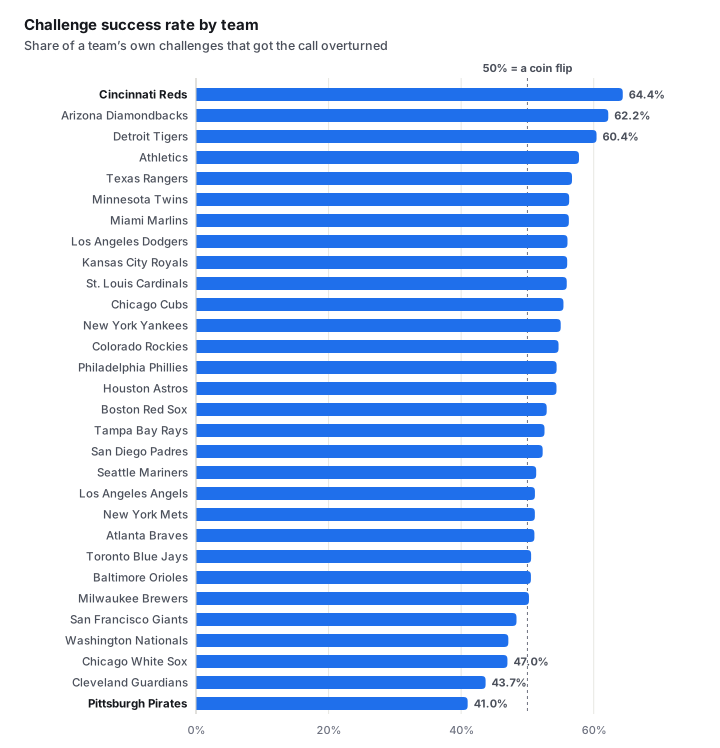
Detroit led the league when I wrote the first post. Not anymore. Cincinnati has climbed to the top at 64.4% (141 of 219 challenges won), with Arizona at 62.2% and the Tigers now third at 60.4%. The Reds are especially good on the defensive side, winning 73% of their catcher-and-pitcher challenges.
The bottom of the table is more stable. Pittsburgh was last in June at 43% and has somehow gotten worse, now sitting at 41.0%. Cleveland (43.7%) and the White Sox (47.0%) round out the bottom three. Challenging at a 41% clip means you would be better off flipping a coin, except the coin does not burn a challenge when it loses.
The umpire list barely changed
Andy Fletcher is still the most overturned umpire in baseball at 73% (38 of 52 challenges flipped). He was at 72% in June, so a month of additional games did nothing to soften that. At the other end, Louie Krupa (32.3%), Derek Thomas (34.6%), and Dexter Kelley (36.4%) keep the fewest calls overturned.
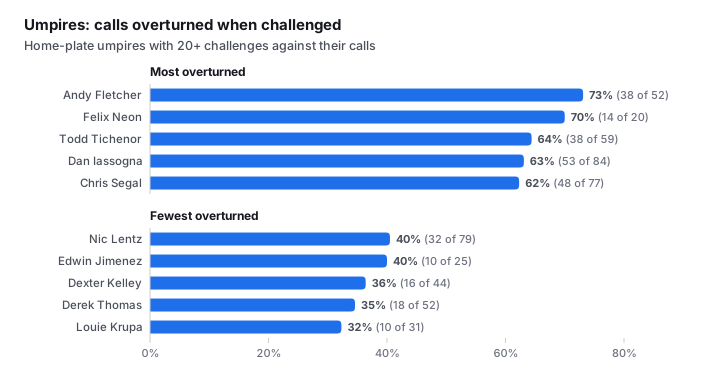
Standard caveat, because it matters: overturn rate mixes two things, how accurate the umpire is and how selectively teams challenge him. A high rate could mean bad calls or it could mean teams only challenge that crew when they are sure. The raw counts are in the tracker so you can judge the sample yourself. But when the same name sits at the top for a month straight, the noise explanation gets harder to defend.
Still no correlation, and that is the story
The question I actually built this thing to answer: does being good at challenges help you win? At the break, with 30 teams and half a season of data, the correlation between challenge success and winning percentage is r = -0.09. Effectively zero, same as June. ERA and run differential are just as quiet (+0.12 and -0.17).
The Reds are the best challenge team in baseball and they are under .500. The Dodgers have the best record in the league and sit eighth in challenge success. Whatever separates good teams from bad ones, it is not this.
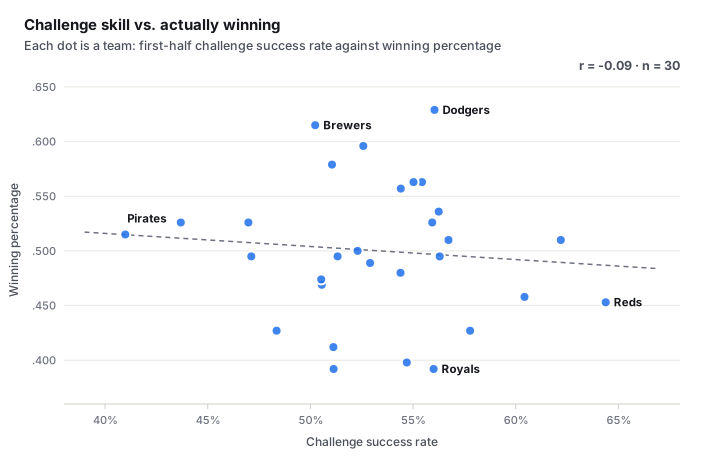
I keep expecting the sample to reveal something, and it keeps telling me the same thing: the challenge system is an accuracy tool, not a competitive weapon. It fixes wrong calls. It does not decide pennant races. Honestly, that is probably exactly what you want from it.
Second-half watch list
Three things I will be watching after the break. Does the league rate ever break out of the 53% band, or is that just what human strike-calling error looks like at scale? Does Fletcher stay a consistent outlier with another 40 challenges on the ledger? And I still owe myself the edge-distance analysis, how close the challenged pitches actually were, which should separate the bold challengers from the desperate ones.