A preliminary look at TN School Letter Grade Data
Summary
I analyzed the statewide school letter grade data and found that poverty and race significantly impact the letter grades schools receive. The disregard for improvement and the lack of weight given to subgroup performance are evident in the letter grades.
Purpose of this study
Following the release of school letter grades, which I previously discussed here, I delved into the data. This blog is the first in a series where I will cover basics such as distributions, means, and some demographic data. Due to the urgency of disseminating this information, I will rely on basic Python graphs rather than more sophisticated visualizations.
Data Sources
The data files used are available here. I used demographic data from the 2021-2022 academic year as the 2022-2023 data is not yet accessible. The slight variation should not significantly affect the outcomes, but I intend to reanalyze with the new data upon release.
In the state demographic data, categories with less than 5% or more than 95% of students do not disclose actual numbers. For consistency, I substituted these with 2.5% and 97.5%, respectively, even though it may minimally affect correlation calculations.
Out of 1900 schools listed for letter grades, 210 (11.05%) were ineligible. These schools were excluded from this analysis.
Distribution
The letter grades were distributed as follows:
A: 294 (17%), B: 441 (26%), C: 513 (30%), D: 350 (21%), F: 92 (5%)
This distribution resembles a normal curve, skewed slightly with more A’s than expected. While a normal curve would have 68% of data in the middle, here we see 77% of schools as B, C, or D grades.
[caption id="" align=“alignnone” width=“479”]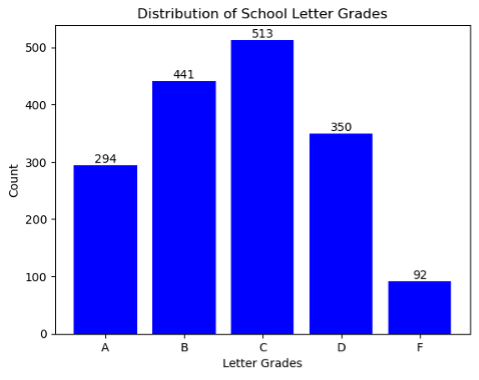 The distribution of letter grades across all schools in TN. [/caption]
What Influences a Grade
I examined the means for each category (Achievement, Growth, and Growth25) for each letter grade to provide insights similar to our understanding of federal accountability.
Grade A:
-
The overall success rate for all students is at an average of 57.34%.
-
The average growth numeracy score stands at 4.45.
-
The average growth literacy score is 4.11.
-
The average letter grade score is 4.85.
Grade B:
-
The overall success rate for all students averages 43.87%.
-
The average growth numeracy score is 3.72.
-
The average growth literacy score comes in at 3.36.
-
The average letter grade score is 3.90.
Grade C:
-
The overall success rate for all students is around 32.72%.
-
The growth numeracy score averages at 2.94.
-
The growth literacy score averages at 2.92.
-
The average letter grade score is 2.92.
Grade D:
-
The overall success rate for all students averages 22.76%.
-
The average growth numeracy score is 1.88.
-
The average growth literacy score is 2.31.
-
The average letter grade score is 1.95.
Grade F:
-
The overall success rate for all students is the lowest, at an average of 11.67%.
-
The average growth numeracy score is 1.55.
-
The average growth literacy score is 1.91.
-
The average letter grade score is 1.23.

For schools receiving an ‘A’ on the state report card, the average success rate is 57.34%, indicating that over half of their students achieved proficiency on TN Ready tests. This surpasses the full points threshold for achievement, which is set at 45% for elementary, 42.5% for middle, and 40% for high schools. In stark contrast, schools with an ‘F’ have only 11.67% of students reaching proficiency. These discrepancies suggest that factors beyond instruction quality, teacher performance, or student effort are at play.
To understand the breadth of these disparities, I analyzed how schools within each Letter Grade Group performed across different categories, all measured on a 5-point scale.
Average Achievement Scores by Letter Grade:
-
A: 4.85
-
B: 3.95
-
C: 2.96
-
D: 2.00
-
F: 1.02
Average Growth Scores by Letter Grade:
-
A: 4.96
-
B: 3.92
-
C: 2.80
-
D: 1.62
-
F: 1.00
Average Growth25 Scores by Letter Grade:
-
A: 4.45
-
B: 3.58
-
C: 3.10
-
D: 2.64
-
F: 3.21
[caption id="" align=“alignnone” width=“580”]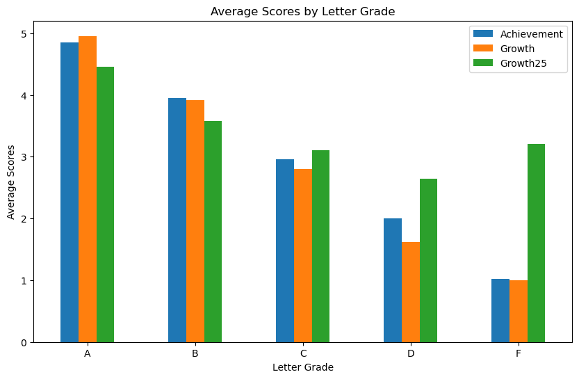 Average Scores by Letter Grade by Category [/caption]
It is immediately apparent that schools with an ‘F’ were disproportionately affected by the inability to demonstrate improvement. The Growth25 metric assesses the advancement of the lowest-performing 25% of test-takers, which often reflects the effectiveness of interventions, tutoring, and other targeted efforts aimed at fostering student progress. Although it’s encouraging to see this segment of students making gains, such improvements were not factored into the overall grade assessment by the state.
Subgroups
What impact did subgroups have on this data?
[caption id="" align=“alignnone” width=“609”]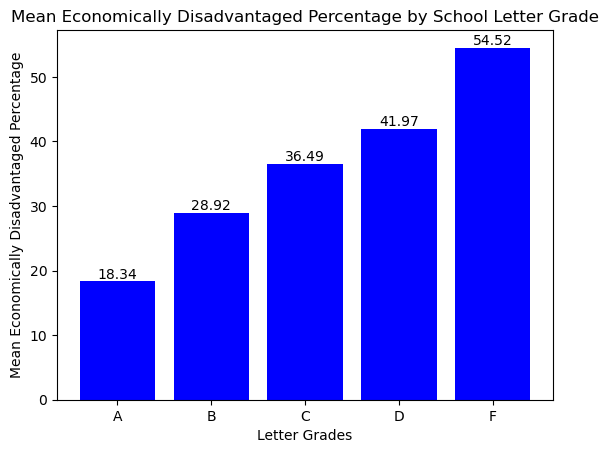 Percent of economically disadvantaged students by letter grade. [/caption]
Economically disadvantaged students’ percentage and letter grades are closely related. For instance, “A schools” average 18.34% of economically disadvantaged students, compared to 54.52% in “F schools.”
The relationship between these demographics and school grades is pronounced and merits further investigation.
[caption id="" align=“alignnone” width=“691”]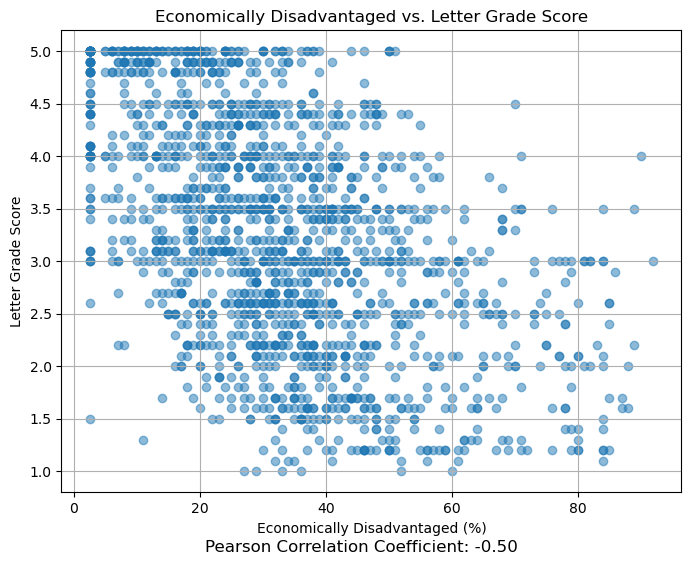 Scatterplot of Economically Disadvantage Numbers and Letter Grade Score [/caption]
The correlation between the percentage of economically disadvantaged students and letter grade scores (r = -0.50, p < 0.05) indicates a moderate negative relationship, suggesting that schools with a higher percentage of economically disadvantaged students tend to have lower letter grades. This is statistically significant, with a p-value near zero.
Other subgroup data needs to be explored as well. This is what the same reports look like for the BHN (Black, Hispanic, Native American) subgroup.
[caption id="" align=“alignnone” width=“571”]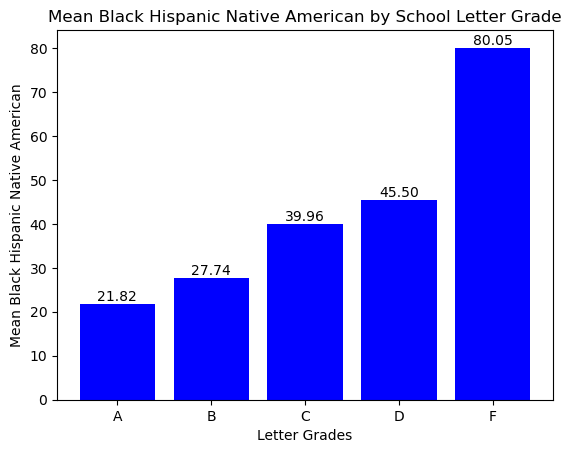 BHN by letter grade group. [/caption]
This is even more extreme than the Economically Disadvantaged data in terms of the difference in means. Let’s look at the correlation data.
[caption id="" align=“alignnone” width=“691”]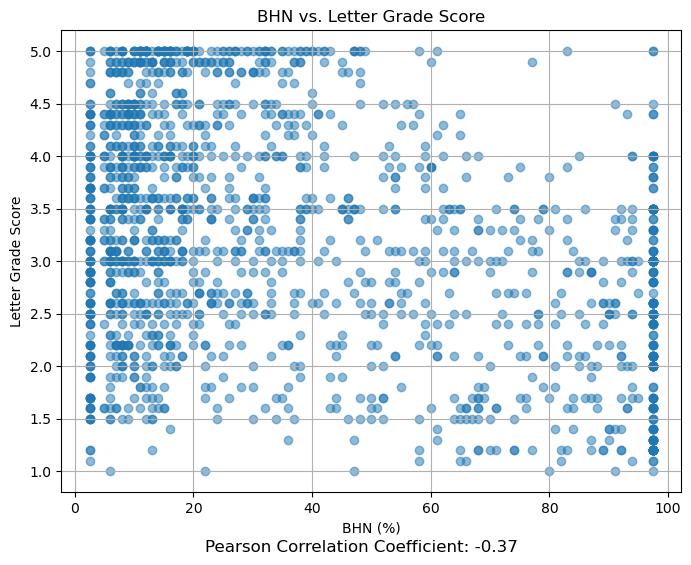 Scatterplot of BHN versus Letter Grade Score [/caption]
For the BHN (Black, Hispanic, Native American) subgroup, the correlation (r = -0.37, p < 0.05) also indicates a moderate negative relationship, with race data showing a significant correlation with letter grades.
Finally, what impact did the percentage of Students with Disabilities have on the data.
[caption id="" align=“alignnone” width=“594”]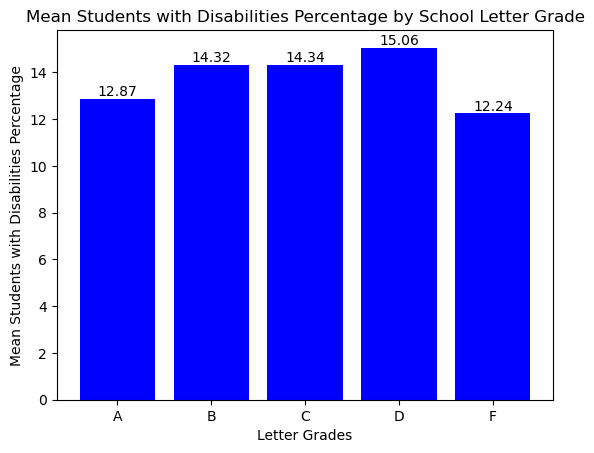 Students with Disabilities Percentage by Letter Grade Group [/caption]
It’s intriguing to note that schools with ‘A’ and ‘F’ grades have almost identical percentages of students with disabilities. This raises questions that I intend to delve into in an upcoming blog post.
[caption id="" align=“alignnone” width=“691”]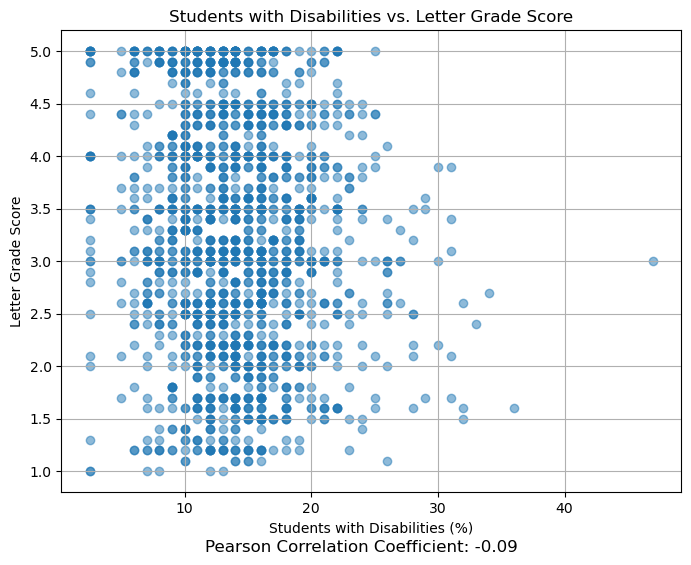 Students with Disabilities percentage scatterplot with letter grade score [/caption]
The percentage of Students with Disabilities (SWD) shows a different trend, with a non-significant correlation (r = -0.09, p > 0.05). This may be due to the fact that this subgroup’s score constitutes only 10% of the letter grade score in the Growth25 category.
Conclusions
More detailed analyses will follow, but this preliminary look suggests significant disparities that need to be addressed. The intent is to bring this to light swiftly.
This blog post was edited by ChatGPT.